Weather Observations by Latitude
The purpose of this project was to determine if there are any observable weather trends as you get closer to or futher away from the equator.
To do this, I created a python script to visualize the relationships between various weather elements and latitude. First I generated a list of 1500 random latitude and longitude coordinates. Then I created a list of unique cities closest to each coordinate set utilizing the citipy module. Next I used a series of API calls to the OpenWeatherMap API to generate a dataset of available cities and various weather observations on a given date--June 25, 2019. Finally, utilizing the Matplotlib library, I plotted measurements for four different weather elements--cloudiness, humidity, maximum temperature, and wind speed--versus the city's latitude. Viewing these plots allowed me to make some observations on weather trends based on latitude.
Visualizations
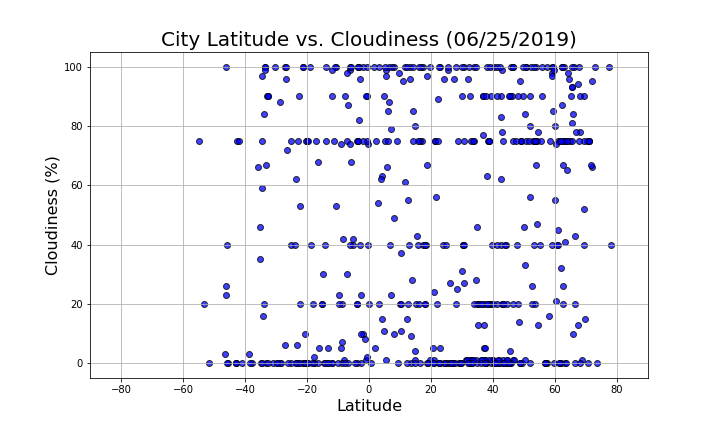
Cloudiness
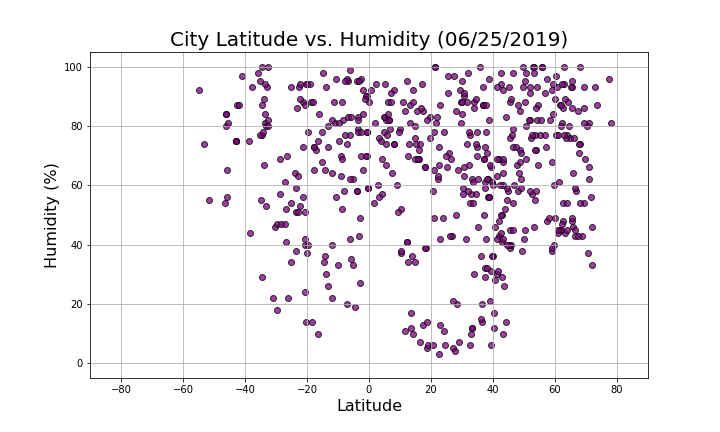
Humidity
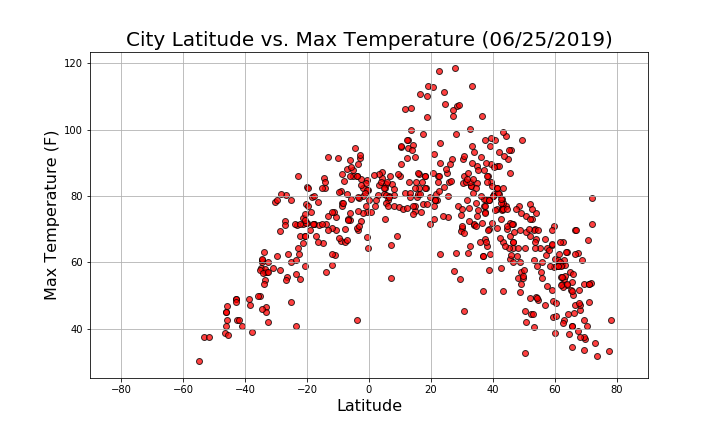
Temperature
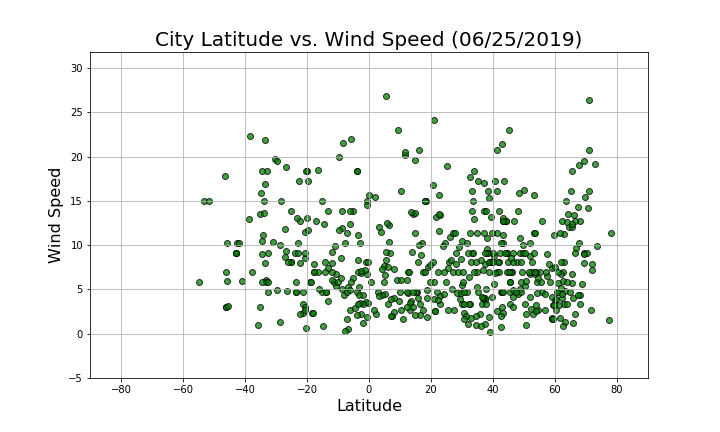
Wind Speed