Maternal Demographics in D3
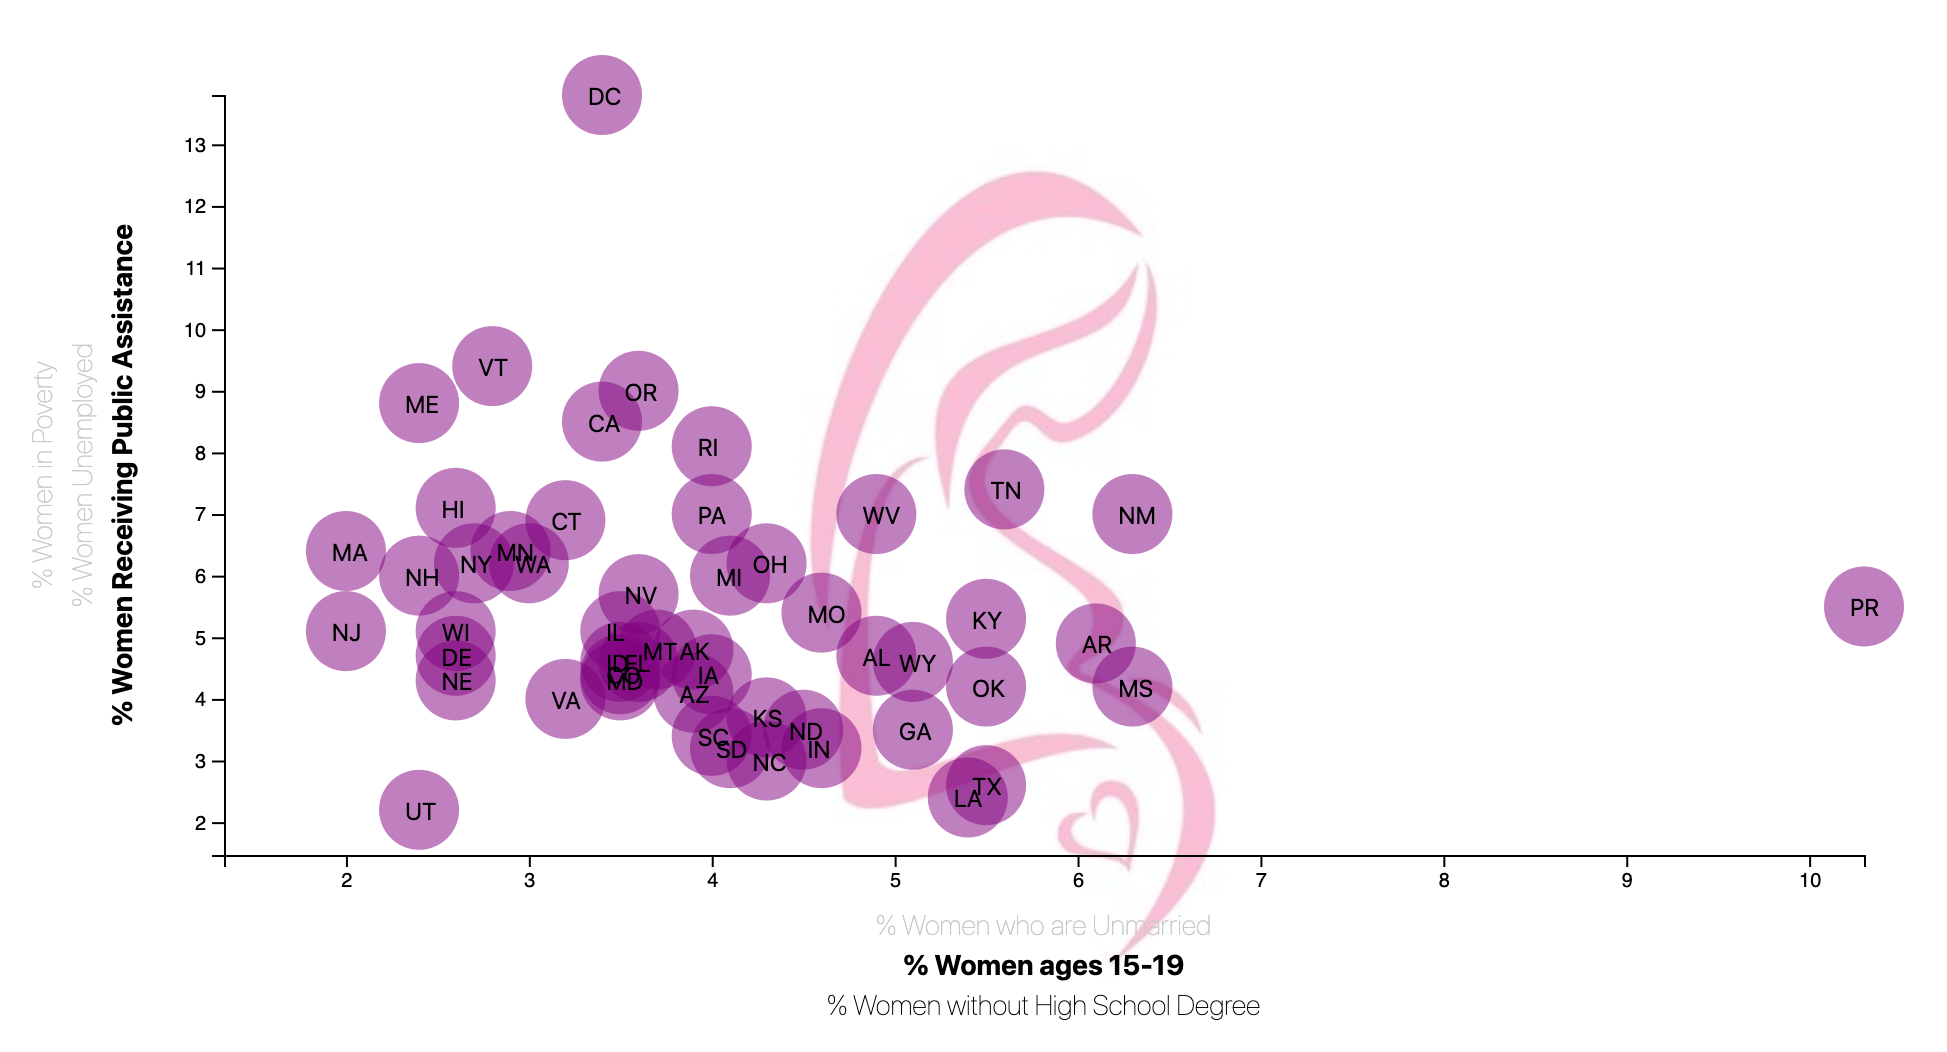
Created an interactive visual representation of demographic data using javascript d3 library. The data I used was gathered from the United States Census quantifying various demographics of women who have possibly given birth in the United States. Using d3, I created a scatter plot where each circle represented a state. That circle's x value represented one demographic and the y value represented another. There are three demographic values that can be chosen by clicking on the different names on the X and Y axes. Both axes are scaled according to the selected datasets. Additionally, there is tooltip functionality that displays exact values for each datapoint. Creating a scatter plot in this manner allows a visual examination of possible correlations between the selected demographics of women who have recently given birth.
GitHub Repository
-
Languages
- Javascript
- HTML
- CSS
Data Rendering and Visualization
- d3 - version 5.5
HTML & CSS
- Bootstrap - version 4.3.1
-
- U.S. Census Bureau and the Behavioral Risk Factor Surveillance System: The population consists of women between the ages of 15-50 who have given birth in the past year, based on 2017 ACS 5-year estimates from the U.S. Census Bureau and the Behavioral Risk Factor Surveillance System. The numbers reported are estimates of the % of distribution for each demographic.
-
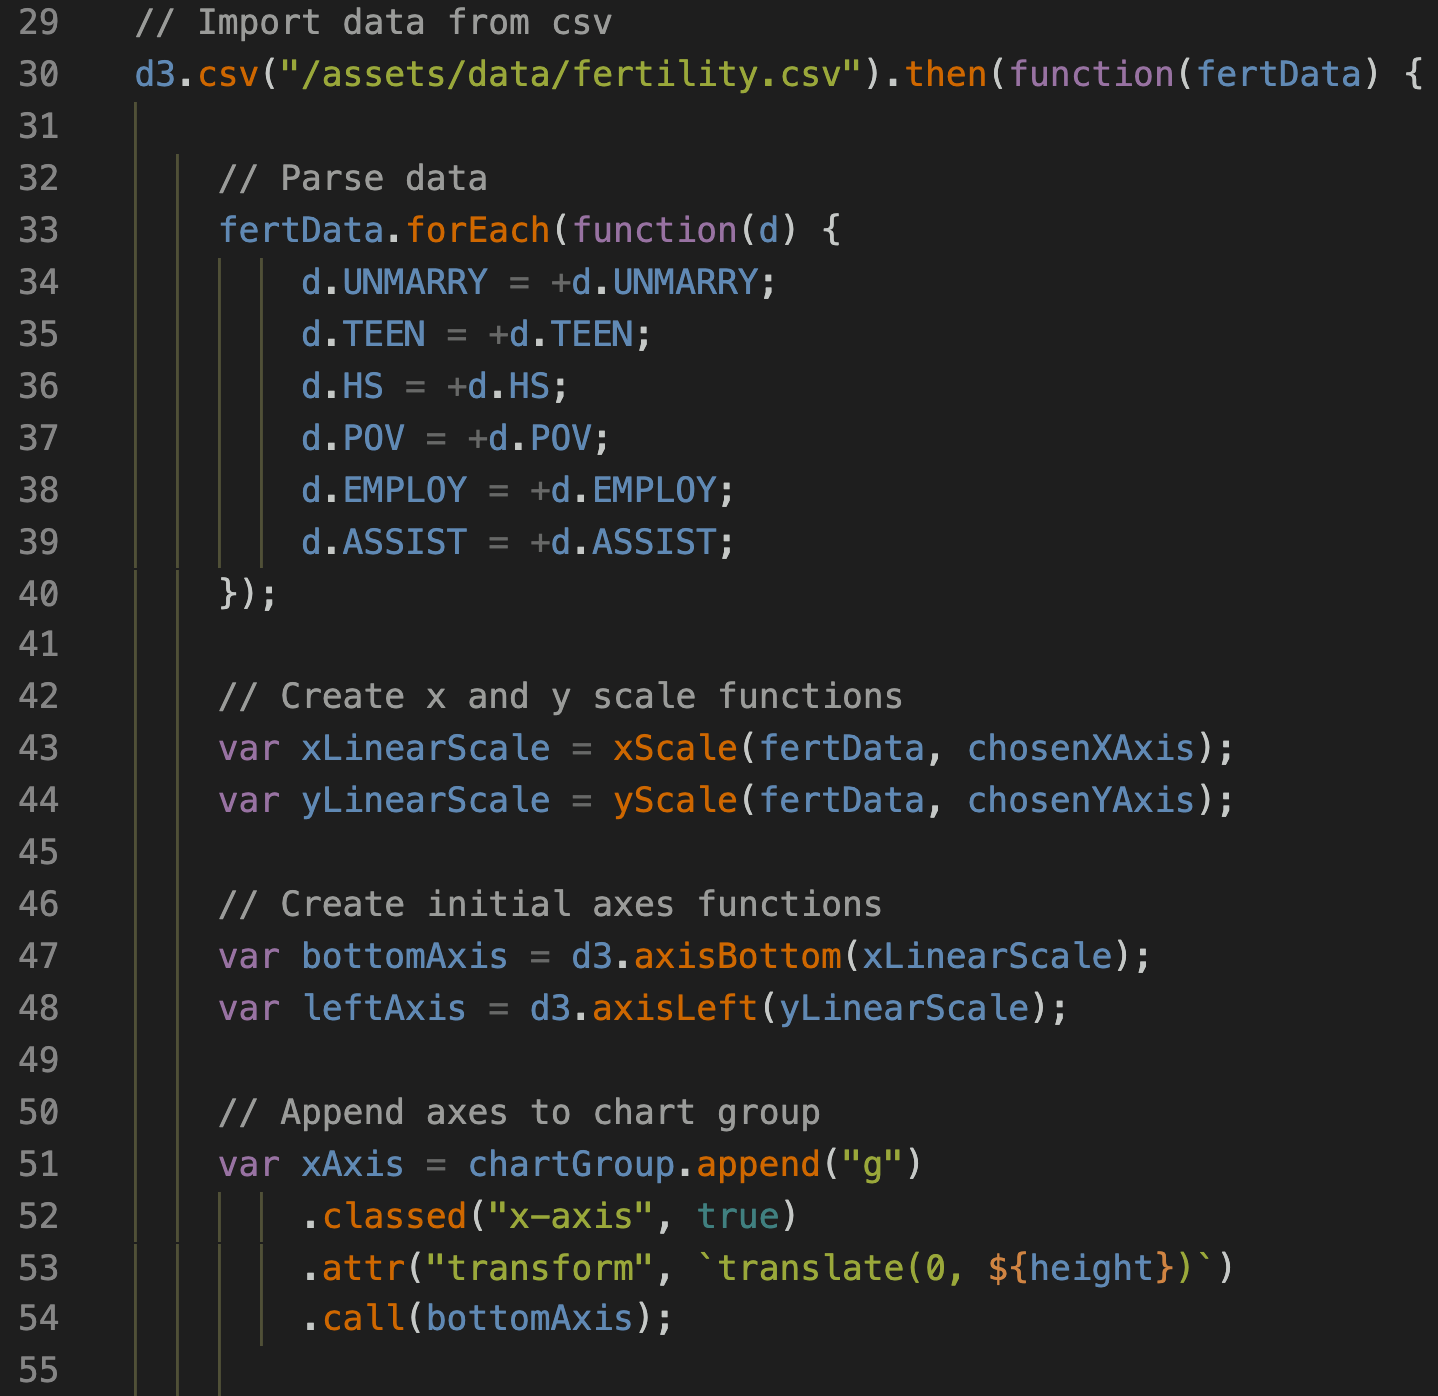
Import Data
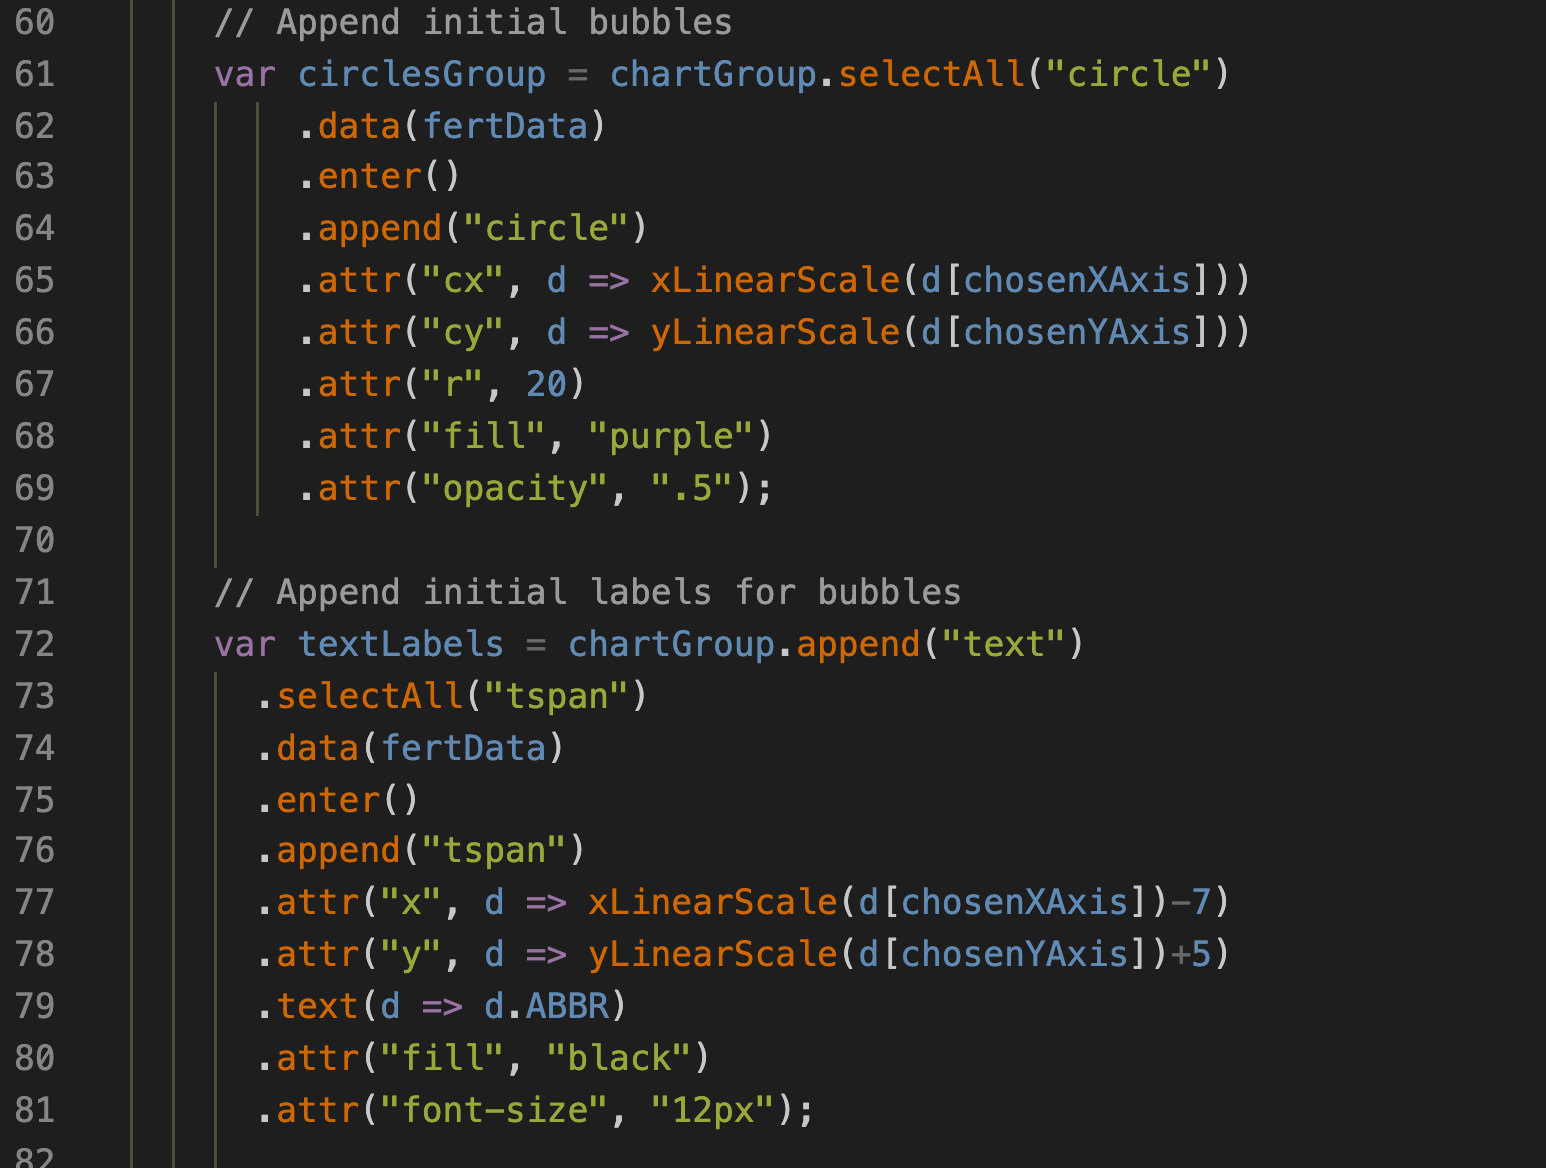
Append Circles
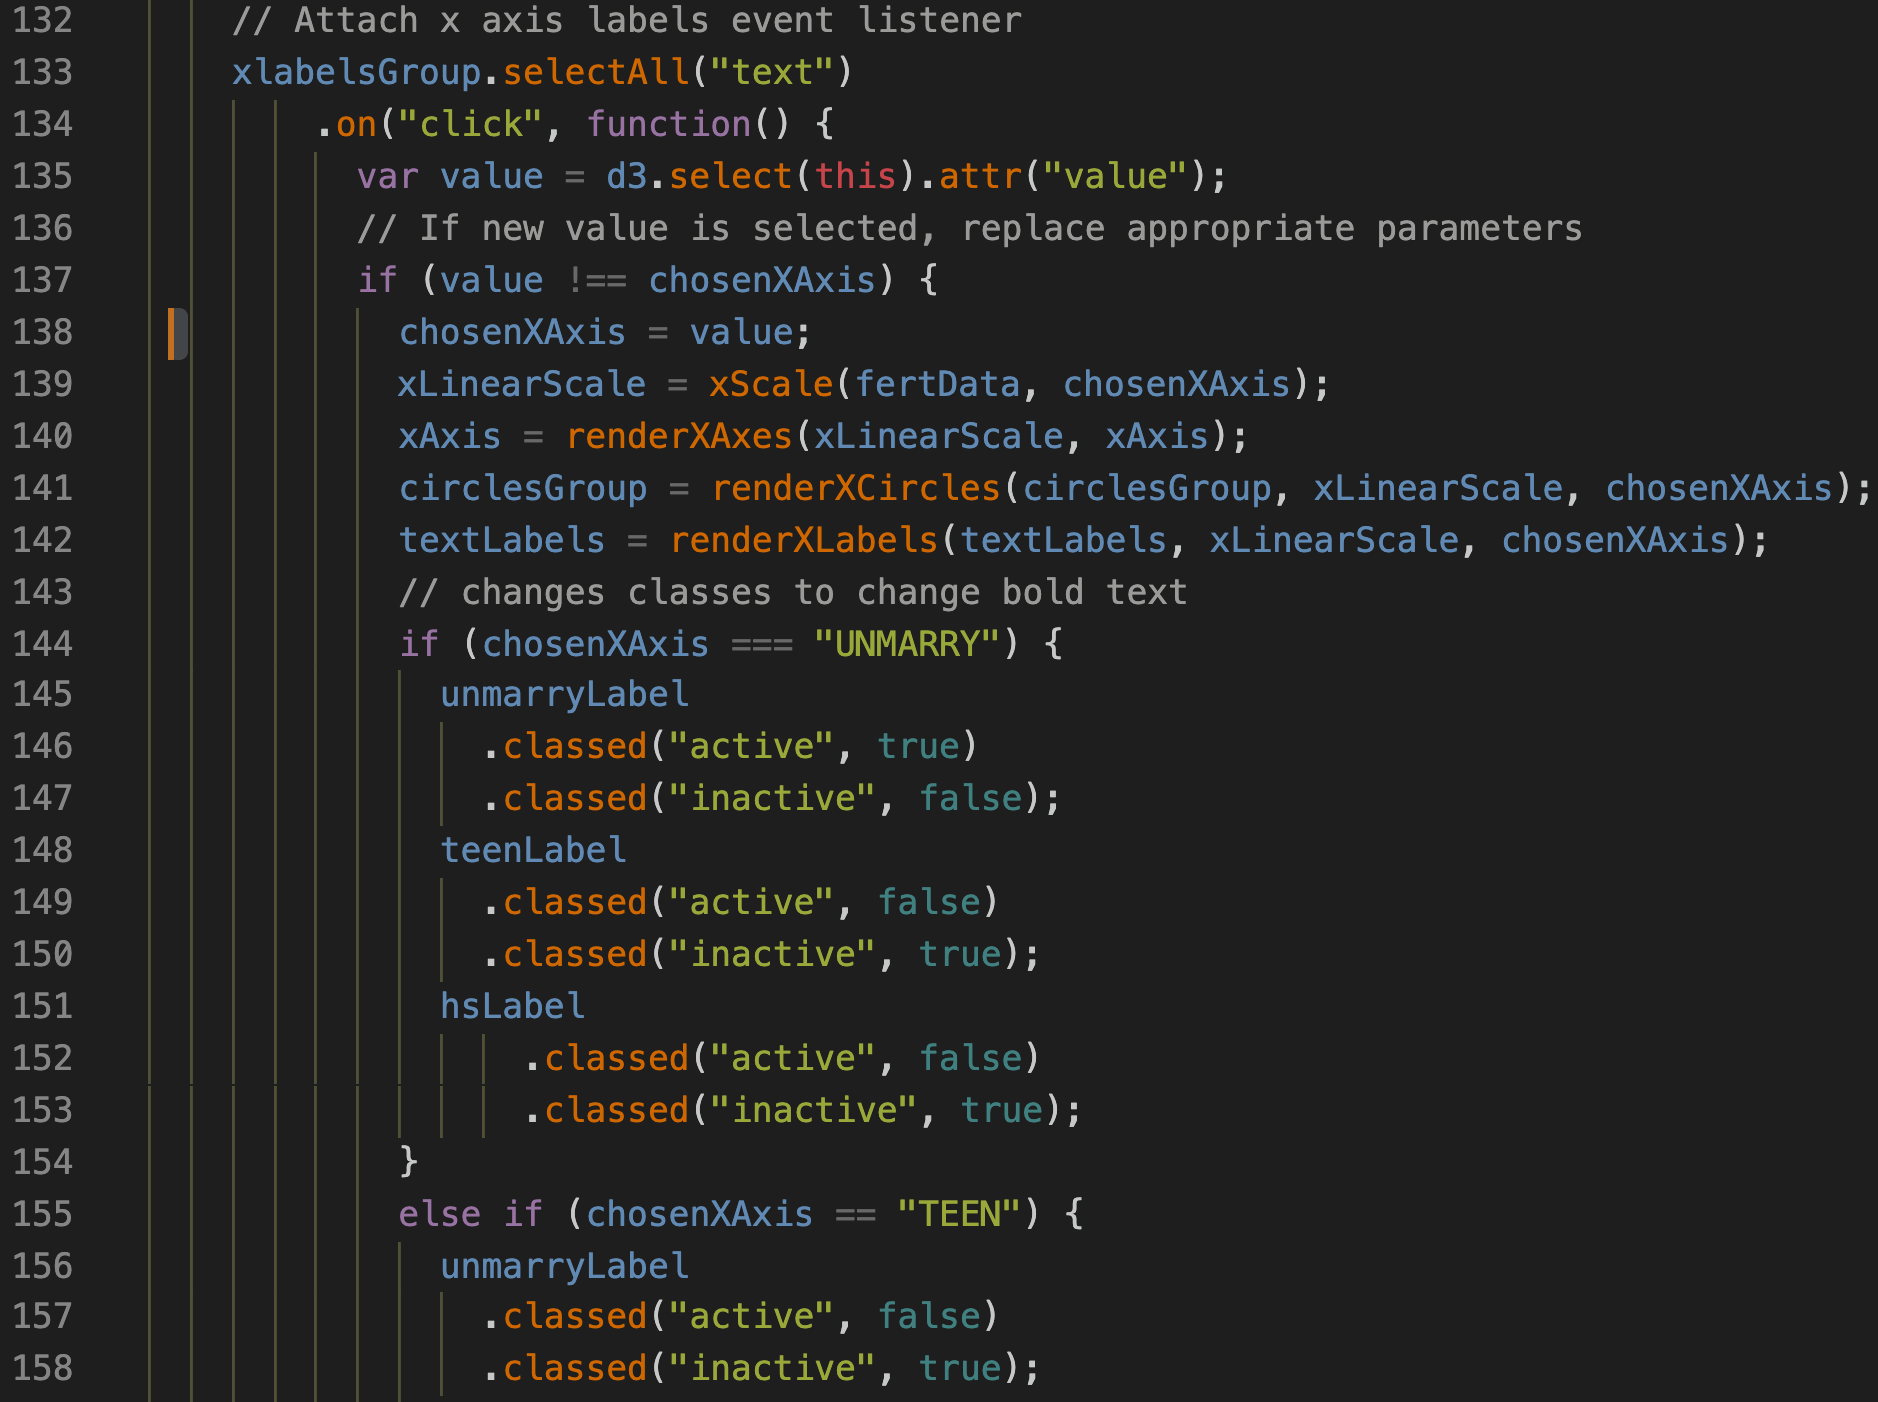
X-axis Event Listener